
Data Dashboards
Data Dashboards created from Excel Spreadsheets and Access Databases
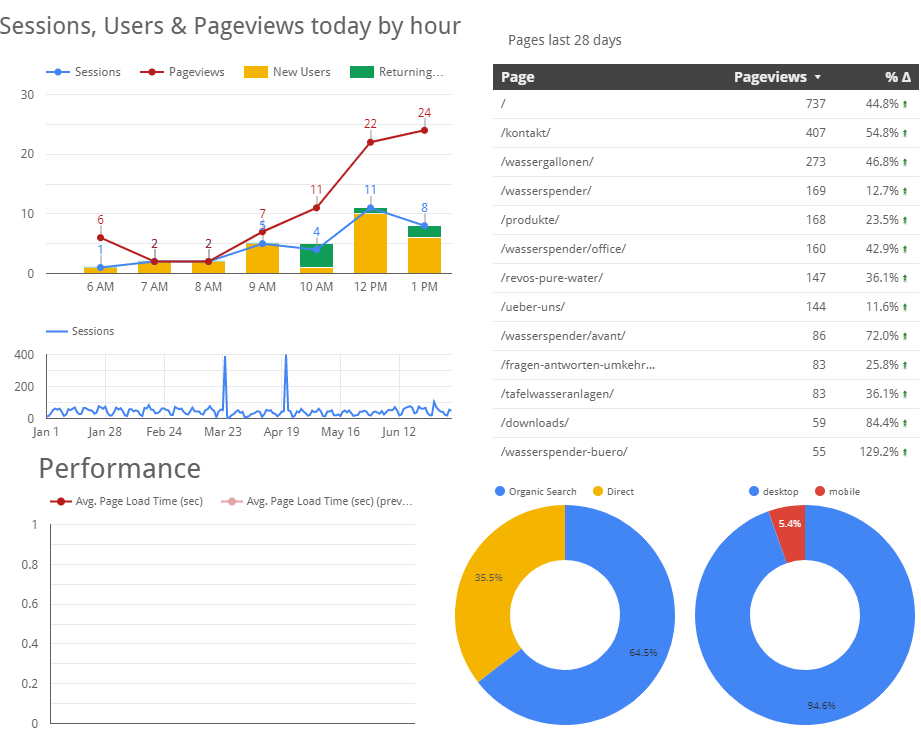
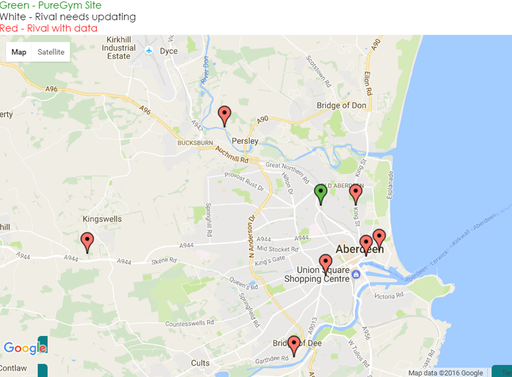
Extract and highlight the key performance indicators for your business using visually rich charts and tables.
Our dashboards and KPI reports present your company-critical information in the form of simple charts, graphs, tables and diagrams, using high impact graphics.
The presentation of your data in a clear, instant, visual format, facilitates fast analysis and professional presentation.
Headline data can be laid out on a single page, meaning it is easy to spot and interpret month-to-month changes, saving time and helping management to focus on key areas of your business.
Dashboards are bespoke and flexible, presented in the format that suits your business best and able to drill down into data of any complexity.
For a free consultation
Either call us now on 020 3817 6945 or fill out the form below and one of our team will be in touch.
Customise your dasboards to reflect key metrics
Dashboards are effective information management tools that visually tracks, evaluates, and presents key performance indicators, metrics and key data.
What makes a good data dashboard?
An effective data dashboard should be distinct yet visually balanced, sophisticated yet straightforward, accessible, user-friendly, and designed to your objectives as well as your audience.

Why are data dashboards important?
Our clients use dashboards to quickly gain insights into the most important facets of their data. They get real time insights and analyses then use them to pinpoint areas that require urgent action, streamlining workflows and accurately directing resources.
What should be included in a dashboard?
- Good data quality
- Add automated data
- Ensure there is enough data for a complete picture
- Make sure the data that's pertinent to the job
Key dashboard elements
- Accurate analysis
- Single page headline data
- Stand out graphics

Dynamic KPI charts
- Drill down capability
- Real-time reporting
- Simple navigation
-version6.jpg)
Contact Us for a Free Consultation and Quote
You can call or email us now on 020 3817 6945 | info@xlteq.com